Category Archives: 2016 Seasonings

Flex 6 and Overall Draft Strategies

Today we will be looking at what we call “Flex 6” and overall draft strategies. As we discussed, there are 6 spots on each OOTL roster which will vary in makeup based on an owner’s strategy. These positions will all strengthen your roster, but with our limited roster size, the downside is that while you get better in one area you are also sacrificing another area.
The key for strategic use of these positions is to improve enough that you are mitigating any glaring team weaknesses. A simple example: If your starter and backup at a position both have poor fielding grades, it is prudent to draft a player that can act as a defensive replacement. But that is only one example of these 6 Flex spots.
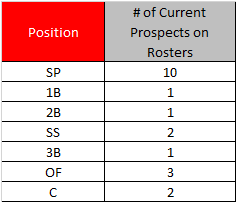
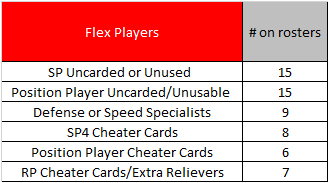
We will start by identifying each category below. The two most popular categories accounting for 50% of the 60 Flex positions are players with no value this season. The other four categories collectively make up the other 50% of the 60 positions and are used as a strategy to help out the team this season. Each team’s two Prospect players are not included below:
FlexPlayers-Chart
THE FUTURE STRATEGIES:
1) SP’s Uncarded or Unused for this season: This category represents 25% of the total Flex 6 players. Several teams use a strategy of stashing high upside starting pitchers with low current grades in the minors for use in future seasons. Others stash veteran uncarded or poorly graded pitchers in the minors in hopes that they will bounce back from an injury or bad season next year. In this service’s opinion, it can be a very effective strategy, but should be limited to one position which has no value for this year. If a SP from this group can be used for a couple of emergency starts or as an emergency reliever, then we support this player. If not, we recommend moving on from these players beyond one roster spot. The roster spots are too valuable and to protect more than one player which has no value is too much of a sacrifice in the present season.
2) Position Players Uncarded or Unused for this season: This category represents another 25% of the total Flex 6 players. Basically the same definition as the above but applied to position players. Our recommendation is relaxed a bit with position players because they can be used in a variety of ways and it is a rare situation where a carded position player has no value whatsoever. For those players and uncarded ones, again our recommendation is no more than one total roster spot should be reserved for a player with no value in the present season.
We understand an owner’s dilemma with the above groups. You draft a Top Prospect with huge upside and he has an unusable card after you took away his prospect status. What do you do? Some teams will tend to hold on to these guys regardless for years. Others will cut bait. We gave our opinion and we also have a new idea to solve the dilemma. Our service refers to both groups as Veteran Prospects and we are proposing a rule change for the 2017 season. (See end of this post.)
THIS YEAR STRATEGIES
3) Defense or Speed Specialists:
4) SP game 4 playoff Starters Cheater Cards:
5) Position Player Cheater Cards:
6) RP Cheater cards & Extra Relievers:
Team-by-Team Strategy Look at Flex 6’s: Subjective and in some cases other players could apply along with multiple categories (just listed/not ranked)
Asians: 1 RP Cheater (Hinojosa), 2 PP Cheaters (Gutierrez, Rayburn), 3 Defense/Speed Specialists (Revere/Marte/Ramos)
Sacrifices: SP4, Mid-level starts, Additional top graded reliever, Future prospects
AB’s: 1 PP Uncarded (Profar), 1 SP Veteran Prospect (Cosart), 1 Cheater Starter (Eichoff), 2 Def/Speed specialists (Gardner,Pillar) and 1 Extra Reliever
Sacrifices: Top Grade Starting Pitcher, Power and Hitting Bench options
Browns: 2 PP Veteran Prospects (Wright, Ramirez), 1 SP Veteran Prospect (Paxton), 1 Cheater SP4 starter (Gilmartin), 1 Def/Speed (Segura), 1 Cheater RP (Albers)
Sacrifices: Mid-level starts, 2nd Big hitter to complement Morales, 3rd C with plus arm, 1B4 full-time.
Bees: 4 Cheater RP’s (Capps, Givins, Vizcaino, Verhaven), 2 Veteran PP prospects(Polanco, Zunino)
Sacrifices: SP depth and future prospects, C+ arm, Big Hitter DH/bench
Eliminators: 4 PP Veteran prospects (Spanberg, Bruce, Mauer), 2 SP Veteran Prospect (Pineda, Nelson), 1 Def/Speed (6th OF)
Sacrifices: Mid-level SP, Top level RP’s, 3rd C +throw
Plague: 3 Veteran SP prospects (Alverez, Darvish, Collmenter), 1 SP4 Cheater (Matz), 2 Veteran Prospect PP’s (Santana, Hunter)
Sacrifices: Top relief, 3rd C +arm, Big Hitting Power card
Lemonheads: 3 Veteran SP prospects (Stroman, Wheeler, McHugh), 1 RP prospect (Walden), 2 Def/Speed specialists (Bradley, Pompey)
Sacrifices: RP innings, 3C def/+arm,
Speakers: 2 Cheater SP4 prospects (Severino, Blanton), 1 Cheater PP (Hernandez), 1 SP Veteran Prospect (Bradley), 2 Veteran PP prospects (2 of Rendon/Wang/Odor)
Sacrifices: Top level RP’s, Relief innings, Big Hitting bat.
Wahoo’s: 2 Cheater PP’s (Blanco, Colabello), 1 Veteran Prospect PP (Meseroco), 3 Veteran Prospect SP’s (Wainewright, Cobb, Bauer)
Sacrifices:  RP innings, Mid-level starts, 3C vs. R, Speed
Stars: 2 Cheater SP’s (McCalister, Wilson), 1 Cheater PP (Casali), 2 Def/Speed (Alonzo, 3C), 1 Veteran SP prospect (Descalfani)
Sacrifices: Big Hitter on Bench/DH, Def OF, 1B vs. LHP
Overall OOTL 3 Year Draft Strategy:
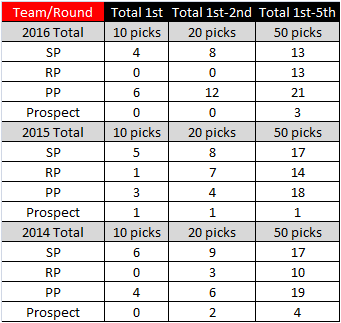
Below is a chart showing the top 10, 20 and 50 picks in the past three drafts. Some interesting notes include:
1st 10 Picks: SP’s decreased from 6-5-4. PP’s went from 4-3-6.  RP’s & Prospects 0-1-0 across the three years.
1st 20 Picks: RP’s roller-coastered 3-7-0, SP’s were flat 9-8-8, Prospects decreased 2-1-0, PP’s down then soared this year 6-4-12.
1st 50 Picks: SP’s flat then decrease 17-17-13, RP’s grew 10-14-13, PP’s grew slightly 19-18-21, Prospects fell then rose again 4-1-3.
Draft-Chart
In the next edition we will tackle Relief Pitching! Below is the Rule Change Proposal:
Rule Proposal: Create 2 new Veteran Prospect roster positions thereby expanding the overall roster to 38 players
1) These players are ineligible to play in the upcoming season so they will not increase an owner’s options or in-game moves.
2) Any current roster player who is carded or has been previously can be made a Veteran Prospect for one season.
3) Any drafted player presently carded or previously carded can be made a Veteran Prospect for one season.
4) Once traded or when the season ends these players will lose their Veteran prospect status.
ASSN

Shartlesville Browns vs. Shooting Stars II

Game 1) Browns finally get in the W column behind Kershaw who went 7 and allowed 2 runs on 8 hits while striking out 5. Game 1 marked one of the trends of the series: big 1st innings by the victors as the Sharts sent 8 to bat scoring 3 runs on 5 hits including homers by Bruce Hairpin and Kyle Seager. Another trend emerged for the Browns in the 5th as they plated 2 runs with only one hit as Morales walked ahead of a Castellanos 2-run bomb. The Browns cruised to an 8-3 victory.
Game 2) Game 2 pitted deGrom against Gallardo and turned on another 2-run/1-hit inning for the Sharts as deGrom walked Seager leading off the 2nd and surrendered a 2 run shot to Salvy Perez. It stayed locked at 2-0 until the 8th when the Stars got a 2-out rally going. Inciarte singled, took 2nd on an error and was plated by a Carpenter base knock to cut the lead to 2-1. Tony Watson got the last out of the 8th and stayed on to pitch the 9th for his first save after the Browns plated an insurance run in the bottom of the 8th to improve to 2-4 with a 3-1 win.
Game 3) The big first inning was back as the Stars knocked Wacha around. Inciarte doubled to lead things off followed by an Escobar walk to set the stage for Carpenter who reached the seats for a 3-run HR. The Stars weren’t done as Casali singled and reached second on a Billy Burns throwing error. He was plated by Choo to push the Stars advantage to 4-0 before the Sharts ever touched a bat. The Browns looked to chip away when Morales actually hit with RISP and doubled in Zobrist in the 2nd, but that was all they had against Kuechel. He waltzed through the Browns lineup allowing 1 run on 2 hits while walking 2 and K’ing 10 (including 6 in a row in the 6th and 7th) to get the W. Soria and Smith were perfect in the 8th and 9th to close it out. Carpenter also added a solo shot in the 3rd inning to help the Stars to a 5-1 win.
Game 4) This game featured both of the big themes of this series. In the top of the 1st the Browns got a leadoff triple from Dyson and an RBI ground out from Phillips followed by back-to-back doubles from Hairpin and Morales to stake Strasburg to a 3-0 lead before he took the mound and it would prove to be all he needed. Phillips and Seager solo jobs in the 5th and 6th made it 5-0 before Inciarte doubled to lead off the 6th and was driven in by Teixeira to cut the lead to 5-1. Then came the familiar scenario in the 8th as Hairpin walked and Seager smacked a two-run shot for another 2-run/1-hit inning, the third for the Sharts in the series. Seager ended up 4/2/4/3 with 2 HRs and a 2b. Strasburg gave up an unearned run in the 9th but held on for the CG win as the Browns improved to 3-5 behind the 7-2 victory.
Notes: The Browns hit .246 for the series and had their slugging shoes on to the tune of 5 doubles, a triple and 8 homers.

Prospects and Young Men

Today we are analyzing the OOTL Top Prospect positions and team youth. Below is a chart showing the breakdown of the league’s 20 prospect players by position. This year’s breakdown is dead even with 10 Starting Pitchers and 10 position players. The majority of the Top 15 Baseball America prospects are protected. Only Trea Turner, AJ Reed and Andrew Benintendi remain unsigned.
ProspectsByPosition-Chart
As far as the youth breakdown we chose 1990 as our base year. It seemed like only yesterday when in the 2013 draft Xander Bogaerts became the first Asian Tsunami born in the 90’s. Now 1990 players are 25 and 26 years old. Unfortunately, time is going by too fast and we are all getting old. The following chart looks at the number of players per team born 1990 and later as well as the number of current Top Prospects on each team’s roster. Some teams are fortunate to have 3 current top prospects on their roster but the delta is not significant overall.
However, there is a significant difference in the number of 1990 or later born players by roster. As you can see some teams use a draft strategy focusing on youth while others focus more on veteran or proven players. You can win both ways, but it is evident from the chart that some teams have built a strong base team for the future. Of course not all of this youth will pan out. The Tsunamis waited for years for Philip Hughes and Ian Stewart to be productive before pulling the plug. But certainly the teams loaded with youth today look much better on paper for next year and beyond at this point in time. The Speakers and Lyme Bees are both strongly focused on youth. Very interesting in the Lyme Bees’ case as they were still able to get their first championship last season. Only the Eliminators, Shooting Stars and Asians seem unconcerned about transitioning their rosters. The Eliminators made a legendary effort last season to gain a championship and were severely handicapped in this season’s draft. They are also one of the most loyal teams to their veteran players. The Stars had a recent championship with a solid core and have focused on building a Championship-competitive team annually since that year. Finally the Tsunamis are now in year three of their effort to gain an elusive 5th Championship. They have had several misses on youth due to injuries, traded picks in the effort to get over the top (it failed), and focused their 2016 draft on building a team which could win their 5th championship this season.
ProspectsByTeam-Chart
In the next edition we will elaborate on topics discussed here and address the “Flex 6” roster spots. We believe each team has basically 30 requirements for their roster. This includes 6 SP’s, 6 RP’s, 16 position players and 2 prospects. That leaves 6 players for draft strategy. Each team takes a different approach and, by doing so, they strengthen their teams in certain areas but also give up on opportunities in others.
ASSN

Hitting

Today our service will be evaluating hitting. It is the 4th offensive category we have examined that all factor into scoring runs. Our service believes that hitting in the OOTL has evolved to the point where it may be the most important of the 4 scoring factors. If you look at last season, the two teams which dominated the entire season and met in the Championship were also the two best hitting teams. The third best hitting team, The Plague, also made the playoffs. In the past it seemed like OBP, Power and Speed played a greater focus. The Tsunamis won 4 Championships but only 3 of them with good hitting teams. Our service is not sure that in the new OOTL this could be done again as easily. Last season’s best Power and pitching team, the Wahoos, missed the playoffs due to struggles with hitting. We still do think that an average hitting team with great power, OBP and speed has a shot at glory, but it is much harder today than it was in the past. Some reasons include improved bullpens, the draft strategy evolution of cheater starters and relievers and the rules now limiting SB attempts.

Again, with this analysis we chose to take an easier directional approach rather than evaluating every number on every card in each team’s lineups projected vs. lefties and righties. We decided to look at four factors: three of them objective and a subjective analysis only coming into play in one area. The areas being evaluated are as follows:

1) MLB Average +.300: We believe this area will capture the players most likely to have the extra 11’s, 10’s, E opportunities and RP’s. These players on average will have less K’s; and therefore, runners will be moved more easily.
2) 7 or better at 44: With our all-star staffs and bullpens, the 7 or better at 44 is a huge advantage over an 8. It shakes out the players who may be better in MLB than the OOTL because they were bogged with 10’s instead of the 7.
3) 7 or better at 55: This is another bonus that usually is reserved to good hitters who do not steal. In the OOTL the 7 at 55 is a goldmine.
4) Pluses vs. L and R: This is the subjective analysis, but is an equalizer for players with significant 8’s. A team with strong pluses can make up for deficiencies in the above three ratings.

Below is a chart based on our findings. The pluses category grade is either a plus, even or a minus representing each team’s collective value and number of plus players. On another note, an interesting finding was that there are no teams this year which grade out terrible vs lefties. As we discussed in another report, there are usually 1-2 teams which will struggle greatly vs. lefties. There are certainly teams where it makes sense to pitch or not pitch a LHSP against this year, but all teams will have a good opportunity to compete.

Hitting-Chart

BEST HITTING TEAMS:

1) Asian Tsunamis: Once again the Tsunamis are at the top of an offensive category. This team is loaded with Power, BB and hitting. Our service believes they are positioned to break the OOTL runs scored record this season. The question is whether it will be enough to offset their opportunity areas. Their only hitting limitation is a lack of strong pluses and number of pluses vs. both RHP and LHP.

2) The Plague: The strongest in the league with the most .300 hitters are loaded with 11’s. However, a below average number of 7’s at 44 will cause trouble against top-rated pitching. The Plague will still be a strong hitting team and–combined with their speed and OBP ratings–will still score runs. The question mark will be whether that will be enough to overcome the lack of power and 7’s at 44.

THE NEXT BEST:

3) AB’s: With three .300 hitters and eight 7+’s at 44 this team looks strong offensively. Added to that is a large number of plus players with several large vs. splits. Combining this with strong OBP and speed grades should make for some interesting shootouts. Good enough for an “A” rating in most years but are in the “B” group to differentiate from the Asians and The Plague, which simply have more weapons.

4) Wahoo’s: A huge improvement over last year’s team in hitting. With 3 players having 7+ at 55 the Wahoo’s should be strong enough to score many more runs this year.

AVERAGE:

5) Speakers: The Speakers head up this group and therefore the overall race has gotten much tighter. The 2 players with 7+ at 55 and a crew of strong pluses will make an impact, but with only 5 players having 7+ at 44 this team will go through some run scoring droughts. However, the Speakers strong speed and Power ratings along with the 7’s at 55 should allow this team to still compete for one of the top spots. Their overall lead though has narrowed significantly from this category.

6) Shooting Stars: Right there with the Speakers but slightly below the next best group. A strong plus rating and additional 7 at 44 will be complimented by the Stars strong OBP rating.

7) Lemonheads: Docked a couple of spots due to limited pluses of regular players but basically tied with the two teams above from a hitting perspective. Lower BB and Power ratings will means less runs for this team overall.

8) Lyme Bees: Very close to the above three teams but no 7’s at 55 this year will hurt run production. A huge step down this year for this team over last year.

THE REST:

9) Browns: Again no 7’s at 55 hurt but a strong plus contingent will help push in runs. Overall limitation of 5 players with 7+ at 44 will cause some droughts. Moving runners will be key to the Browns success.

10) Eliminators: Another big drop off from last year. Only one .300 hitter and 5 players with 7 at 44 and none at 55 will make for many low scoring efforts. Again moving runners will have to be the equalizer for this group.

One thing we should stress is that there are many ways to win in the OOTL and many ways to engineer runs. No team is grading out overall where they have no chance to make the playoffs. Each team has different strengths and different opportunity areas. Trades can also change things dramatically overnight. The race for the top three seeds has now tightened up considerably. All other teams still have a shot at the 4-5 seeds. The Bullpen category remains as the main factor left to impact the overall ratings. In the next edition we will make a left turn and look at youth and top prospects. In this service’s opinion, it takes a minimum of two years to build a championship contender; therefore, this will be an important analysis for the future as well as for the top teams as this group will also be trade resources!

ASSN

Fielding

In this report our team will tackle Fielding.  Our analysis will be both objective based on the hard numbers of each team’s defensive ratings by position but also subjective as we had to make projections on likely lineups. Also our team values some factors greater than others from a fielding perspective and these positions often effected our overall team ratings. On the positive side: 9 SS, +3 and above Catcher arms and +33 and above outfielder arms. On the negative: Pct of starts/innings for pitchers graded 1, 3B 3’s, and 1B 2-3. One interesting note is that in this services opinion, there are no poor fielding teams. Due to our all-star level teams, while some teams have a position or two which will cause frustration, there is no team which should be fielding 3 and putting a bad fielding team in play. In fact with the exception of 3 outliers, the majority of teams are very close in their team fielding ratings.
Best of the Best:
1) Speakers: Once again the Speakers earn a high rating in a category. 5 ratings at 1st and 3rd, 10 at SS, 1-2 starting OF3’s, and a C9 with +3 arm will compliment the Speakers highly ranked rotation and make runs challenging for their opponents. The only real watch out may be the OF2’s and number of innings and starts by P1’s.
Above Average:
2) The Plague: We give the nod to The Plague but the next 7 teams are very closely ranked.  5 ratings at 1st and 3rd, SS9, 3 OF3’s, and mostly P2’s put them up there right below the Speakers. The only concerns are the C7 -3 throwing catcher which will start most of their games and a predominance of P1 relief innings.
3) Lyme Bees:  5 ratings at 1st and 3rd, SS9, 3 OF3’s, OF +arms and mostly RP2’s for the good.. The only concerns are: 2B7,  P1 relief innings and C7 or C8 -2 arm games.
4) Eliminators: 3B5, 2B9, 3 OF3’s and mostly SP2’s for the good. The only concerns are: SS8, P1 starting games and no positive C arms.
5) AB’s: 1B5, SS9, 2-3 OF3’s, and OF +arms for the good. Concerns are: Likely 3B3 and some SS8 starts, C7 -2 games, and significant P1 starts and relief innings.
6) Lemonheads: 1B5, 3B5, SS9, and P2 for most starts and relief are the positives. Likely significant 2B7 and OF2 starts, C7 starts, and no strong C throwing arm are the concerns.
7) Wahoo’s: SS9, 3B5, C8 with good arm, and P2 starters are the strengths. Likely 1B3 starts, OF arms and significant P1 relief innings are only concerns.
8) Asian Tsunamis: 2B9, P2 majority of starts and relief innings and C option with +3 arm are the strengths. The concerns are SS8, OF2’s and likely C negative throwing arm starts.
Average:
9) Shartlesville. Browns: 3B5, and C9 are strengths. Challenges will include: 1B2 and SS7 starts, P1 starts/relief innings, OF2’s, and no strong catching arm.
10) Shooting Stars II: Solid but not great ratings at all positions are the strengths. Concerns are: C7 or C8 -3 games, SS8, P1 starts and relief innings, OF2 or OF1 games and limited + throwing C games.
So we are now half way through our 10-part pre-season series. At this point an aggregate analysis has 9 teams very close to each other in the battle for the 2nd and 3rd place rankings. In the OOTL it is critical to earn a top 3 seed to get a bye in the Playoffs first round. One team, the Speakers, is clearly ahead of the others in the rankings at this point. However, Bullpens and Hitting are two major categories which remain. Can the Speakers do well enough in those areas to hold on to a top three spot? That question will be answered in future edition. Next up is Hitting!!!
ASSN